- /
-
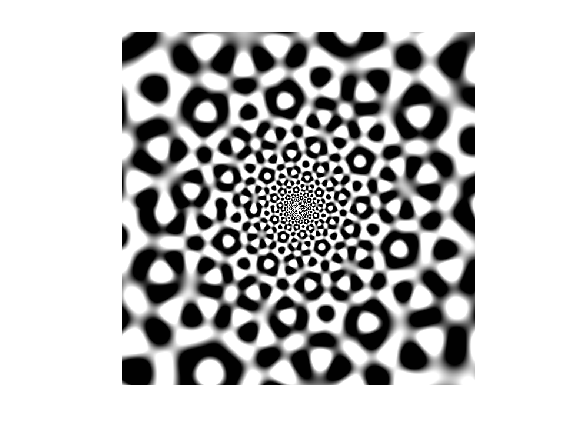
Quasicrystal Log Normal Spirals
on 27 Oct 2022
- 6
- 51
- 1
- 0
- 164
% Quasicrystal visualization via summation of plane waves
% Display with log-normal mapping
% Based on my File Exchange submission:
% https://mathworks.com/matlabcentral/fileexchnage/56593
N=600; % Dimension of output image
s=30; % Scale - number of periods per wave
m=5; % Integer number of plane waves to sum (m-fold symmetry)
p=1; % Phase parameter - vary to animate output
x=ones(N,1)*(1-N:2:N-1)/2;
r=-log(hypot(x,x'))*s;
x=atan2(x',x)*s;
q=0;
for a=(0:m-1)*pi/m % Sum m plane waves over [0, pi)
q=q+cos(x*cos(a)+r*sin(a)+p);
end
c=255/2;
imshow(uint8(q*c/p+c)+1,gray); % Scale/clip output to [0,255], apply colormap