


- /
-
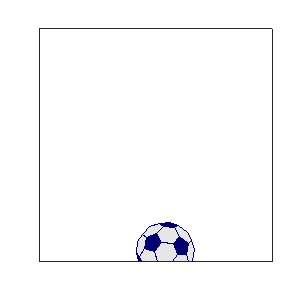
Bouncing Bucky Ball
on 16 Nov 2023
- 10
- 131
- 0
- 1
- 1133
drawframe(1);
Write your drawframe function below
function drawframe(f)
% function Bouncing_Bucky(f)
% Mini hack version
% for f = 1:48
% Bouncing_Bucky_hack(f)
% pause(1/24)
% end
%
% https://blogs.mathworks.com/cleve
if f == 1
init_graphics;
% Adjacency matrix and vertices of truncated icosahedron
[B,V] = bucky;
V = V/8;
% Color pentagons and hexagons
blue_gray = 0.9*[0 0 .5; 1 1 1];
C = allcycles(graph(B), maxCycleLength = 6);
L = cellfun(@length, C);
F = NaN(height(C), max(L));
for k = 1:height(C)
F(k,1:L(k)) = C{k};
end
FaceColor = blue_gray((L == max(L))+1, :);
% Handle Graphics Transform object.
H = hgtransform(Parent = gca);
% Patches
patch(Parent = H, ...
Faces = F, ...
Vertices = V, ...
EdgeColor = blue_gray(1,:), ...
FaceVertexCData = FaceColor, ...
FaceColor = 'flat')
% Frames per second
fps = 24;
% Initial position {x,y,dx,dy}
initial = {0.5, 0, 1/fps, 1/fps};
set(gca,'userdata',initial)
end
% One step
g = get(gca,'userdata');
[x,y,dx,dy] = deal(g{:});
x = x + dx;
y = y + dy;
% Bounce
if x < 0 || x > 1
dx = -dx;
end
if y < 0 || y > 1
dy = -dy;
end
% Transform matrix with fake rotation
beta = 90*(2*x+y);
M = Ty(y) * Tx(x) * Ry(beta) * Rx(2*beta);
H = get(gca,'children');
H.Matrix = M;
% Save position for next frame
set(gca,'userdata',{x,y,dx,dy})
% -------------------------------------------------------
function R = Rx(t)
R = [1 0 0 0
0 cosd(t) sind(t) 0
0 -sind(t) cosd(t) 0
0 0 0 1];
end
function R = Ry(t)
R = [cosd(t) 0 sind(t) 0
0 1 0 0
-sind(t) 0 cosd(t) 0
0 0 0 1];
end
function T = Tx(x)
T = eye(4,4);
T(1,4) = x;
end
function T = Ty(y)
T = eye(4,4);
T(2,4) = y;
end
function init_graphics
clf
axis([0 1 0 1])
axis square
box on
set(gca,'xtick',[],'ytick',[])
end
end
Animation


