Latest Contributions
I rarely use MATLAB.
10%
use MATLAB almost every day.
55%
use MATLAB once every 2-3 days.
10%
only use when specific task require
25%
20 votes
As far as I can tell, there is still no official support for creating publication-ready tables from regression output, either as latex or natively. Although MATLAB isn't primarily statistical software, this still seems like an oversight, as almost any similar software has this capability built-in or as a package.
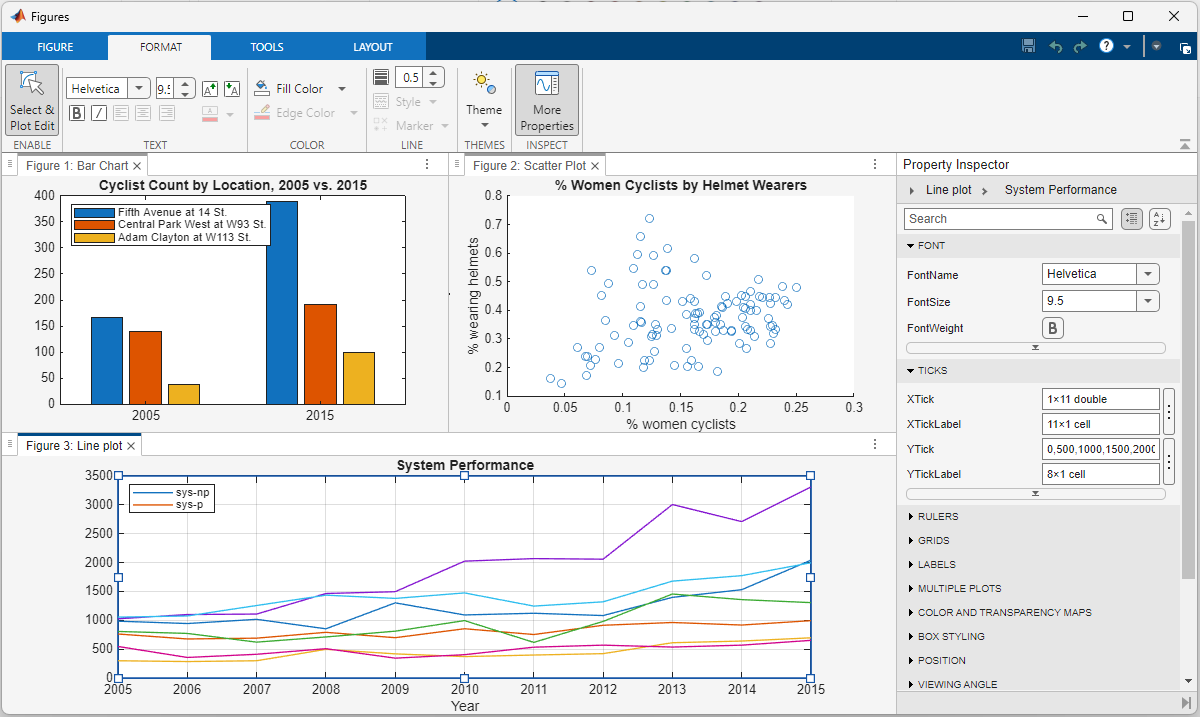
The MATLAB R2025a release gave figures a makeover. @Brian Knolhoff, a developer on the Figure Infrastructure and Services team, reviews the new Figure Container in the Graphics and App Building blog.
Learn the four ways to tile figures, what docking means, and other new features.
I bought standart licence no I cant get it
After waiting for a long time, the MathWorks official Community has finally resumed some of its functionalitys! Congratulations! Next, I’d like to share some thoughts to help prevent such outages from happening again, as they have affected far too many people.
- Almost all resources rely solely on MathWorks servers. Once a failure (or a ransomware attack) occurs, everything is paralyzed, and there isn’t even a temporary backup server? For a big company like MathWorks to have no contingency plan at all is eye-opening. This tells us that we should have our own temporary emergency servers!
- The impact should be minimized. For example, many users need to connect to the official servers to download various support packages, such as the “Deep Learning Toolbox Converter for ONNX Model Format.” Could these be backed up and mirrored to the “releases” section of a GitHub repository, so users in need can download them.
- A large proportion of users who have already installed MATLAB cannot access the online help documentation. Since R2023a, installing the help documentation locally has become optional. This only increases the burden on the servers? Moreover, the official website only hosts documentation for the past five years. That means after 2028, if I haven’t installed the local offline documentation, I won’t be able to access the online documentation for R2023a anymore?
Anything else you’d like to add? Feel free to leave a comment.
The following lines were added to the subplot function in version 2025a (line 291):
if ancestorFigure.Units == "normalized"
waitfor(ancestorFigure,'FigureViewReady',true);
end
That code isn't in version 2024a.
Because of this, I'm experiencing issues that cause the code to stop running when using subplot in this way:
figure('Units','normalized','Position',[0 0 0.3 0.3])
subplot(1,2,1)
...
Has anyone else encountered this error?
Does anyone understand the need for those lines of code?
It is April 3, 2025 now. Where is the MATLAB 2025a?
Any status updates on the license center and add on tool boxes?
@William Rose, Your dedication to helping others and sharing your knowledge is a big win for the community. Thanks for taking the time to contribute so thoughtfully - your impact is definitely being noticed.👏
Keep it up!
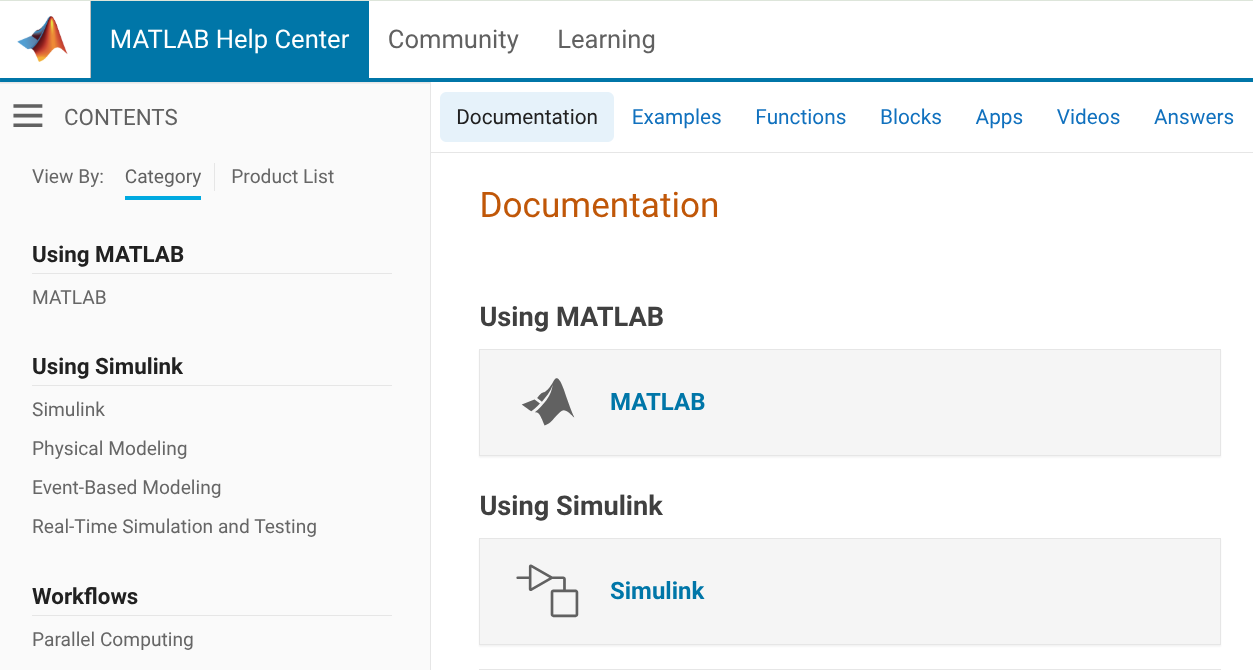
This website is not very attractive or easy to navigate. It is difficult to even find this section - if you start at the Mathworks website, there is no community tab:
You have to go to Help Center, which takes you to documentation, and then click on Community (redirecting you from https://www.mathworks.com/help to https://www.mathworks.com/matlabcentral)
Once you get there it's still a mess
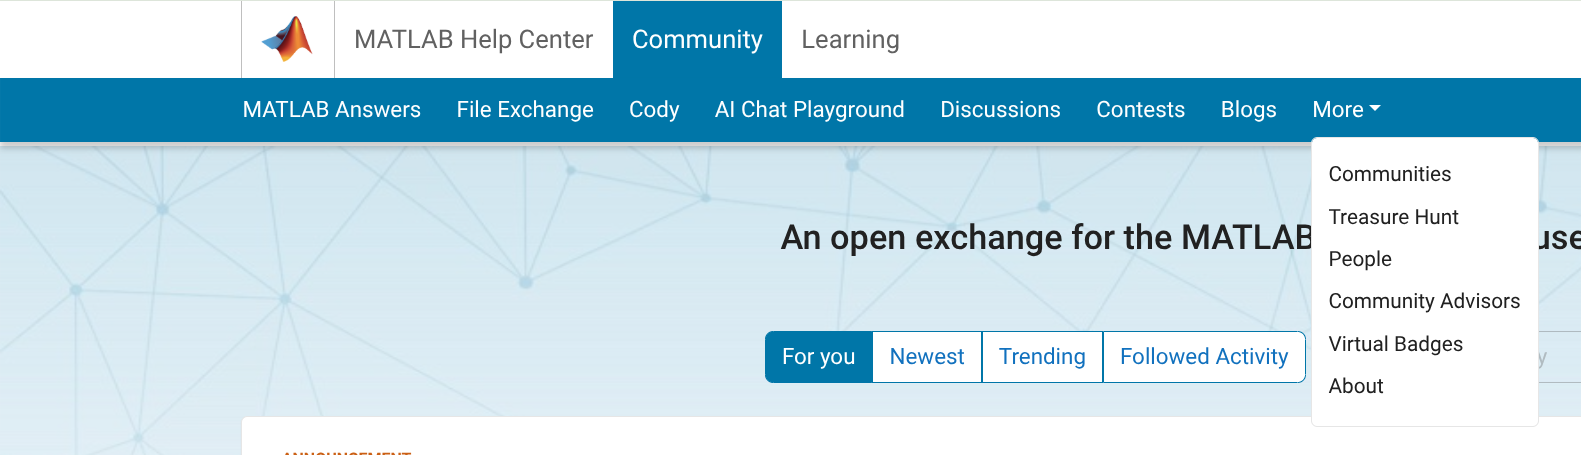
If I have a question, it's not clear whether I should go to MATLAB Answers, Discussions, or Communities. It's not clear what the People page is for, or why it's split off from Community Advisors and Virtual Badges. "Cody" isn't very self-explanatory, and people will only stumble on it by accident, this seems like it should be integrated with contests. Don't get me started on the mess of a Blogs page. My browser knows that I speak English, so why am I being served Japanese language blogs?
I know that web design isn't the main priority of Mathworks, but the website has a very early-2010's look that increasingly feels dated. I hope there will be more consideration given to web UI/UX in the future.
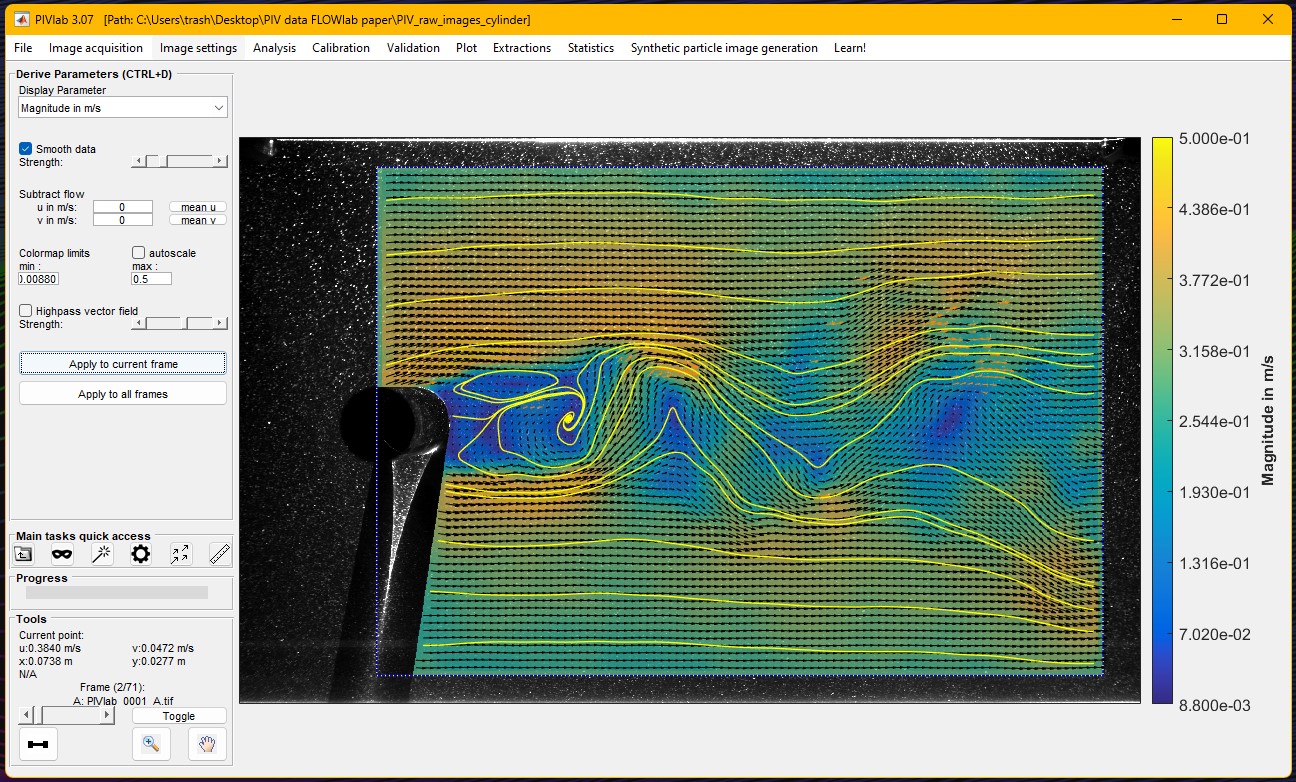
During the past twelve months, PIVlab, a MATLAB Community Toolbox for particle interference velocimetry (a technique for fluid flow measurement) set a new record for all-time File Exchange downloads, surpassing one hundred thousand, dating back to 2010. It also recently eclipsed the 1000 downloads/month mark on File Exchange.
Congratulations to @William Thielicke and his team for this fantastic long term achievement and head over to the File Exchange to download and use it: PIVlab - particle image velocimetry (PIV) tool with GUI - File Exchange - MATLAB Central
Why is RoBERTa not available as a pretrained model? It is superior to BERT in many fields and has become more popular in the literature. For faster inference, you should offer DistilBERT, which is more modern than BERT but smaller/faster. The respository hasn't been updated in two years, which is a lifetime in the field of deep learning.
https://github.com/matlab-deep-learning/transformer-models
I love it all
45%
Love the first snowfall only
15%
Hate it
17.5%
It doesn't snow where I live
22.5%
40 votes
Hi,
We are looking for users of Simulink who also work with the Vehicle Network toolbox to attend a usability session. This wil be a 2 hour session and will offer $100 compensation.
If you are interested, please answer the questions below and send them to: usabilityrecruiting@mathworks.com
In the past 2 years, how often have you worked with ARXML (AUTOSAR XML) files in vehicle network communication?
a. At least 3-5 days per week
b. Once or twice a week
c. A few times a month
d. Once a month or less
e. Never
-
3. Have you worked with automotive ethernet in the past?
a. Yes
b. No
-
4. Which of the following best describe your experience with Simulink? (select all that apply)
Study Screener Q4
a. I have used CAN/ CAN FD blocks (https://www.mathworks.com/help/vnt/can-simulink-communication.html)
b. I have used Simulink Buses
c. I have used Simulink Data Dictionaries
d. Other
-
Thank you!
Elaine
If you are interested in this session, just send an email with the answers to the following questions to usabilityrecruiting@mathworks.com
1. Which of the following best describes your experience with Design of Experiment (DOE)?
a. I regularly use DOE in my work and am comfortable designing experiments and analyzing results
b. I have used DOE in a few projects and understand its principles and applications
c. I have a basic understanding of DOE concepts but have limited practical experience
d. I have never used DOE but I’m interested in learning
-
2. Briefly describe one of your recent projects where you used/want to use DOE. What are the objectives and outcomes?
-
Thank you!
What’s your favorite response from the 'why' command in MATLAB?
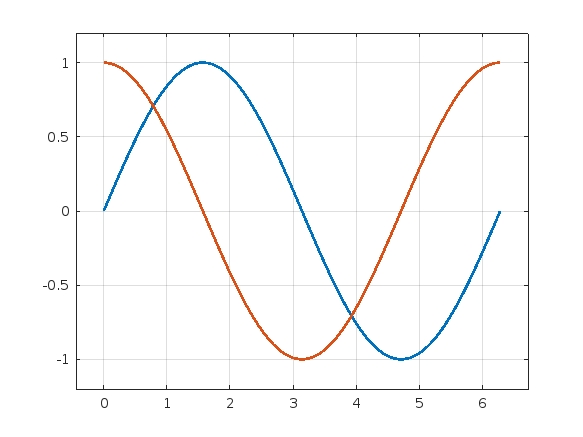
Over the last 5 years or so, the highest-traffic post on my MATLAB Central image processing blog was not actually about image processing; it was about changing the default line thickness in plots.
Now I have written about some other MATLAB plotting behavior that I have recently changed to suit my own preferences. See this new blog post.
Here is a standard MATLAB plot:
x = 0:pi/100:2*pi;
y1 = sin(x);
y2 = cos(x);
plot(x,y1,x,y2)

I don't like some aspects of this plot, and so I have put the following code into my startup file.
set(groot,"DefaultLineLineWidth",2)
set(groot,"DefaultAxesXLimitMethod","padded")
set(groot,"DefaultAxesYLimitMethod","padded")
set(groot,"DefaultAxesZLimitMethod","padded")
set(groot,"DefaultAxesXGrid","on")
set(groot,"DefaultAxesYGrid","on")
set(groot,"DefaultAxesZGrid","on")
With those defaults changed, here is my preferred appearance:
plot(x,y1,x,y2)
What is MATLAB Project?
40%
Never use it
28%
Only use existing from others' proj
3%
Use it occasionally
13%
Use it frequently
16%
90 votes
Can anyone provide some matlab learning paths, I am a novice to MATLAB, I would appreciate it
clc; clear; close all;
% Initial guess for [x1, x2, x3] (adjust as needed)
x0 = [0.2,0.35,0.5];
% No linear constraints
A = []; b = [];
Aeq = []; beq = [];
% Lower and upper bounds (adjust based on the problem)
lb = [0,0,0];
ub = [pi/2,pi/2,pi/2];
% Optimization options
options = optimoptions('fmincon', 'Algorithm', 'sqp', 'Display', 'iter');
% Solve with fmincon
[x_opt, fval, exitflag] = fmincon(@objective, x0, A, b, Aeq, beq, lb, ub, @nonlinear_constraints, options);
% Display results
fprintf('Optimal Solution: x1 = %.4f, x2 = %.4f, x3 = %.4f\n', x_opt(1), x_opt(2), x_opt(3));
fprintf('Exit Flag: %d\n', exitflag);
%% Objective function (minimizing sum of squared errors)
function f = objective(x)
f = sum(x.^2); % Dummy function (since we only want to solve equations)
end
%% Nonlinear constraints (representing the trigonometric equations)
function [c, ceq] = nonlinear_constraints(x)
% Example nonlinear trigonometric equations:
ceq(1) = cos(x(1))+cos(x(2))+cos(x(3))-3*0.9; % First equation
ceq(2) = cos(5*x(1))+cos(5*x(2))+cos(5*x(3)); % Second equation
ceq(3) = cos(7*x(1))+cos(7*x(2))+cos(7*x(3)); % Third equation
c = [x(1)-x(2); x(2)-x(3)]; % No inequality constraints
end
About General
Discuss a wide range of MATLAB topics and share your thoughts and opinions with other community members.
This is the channel to post to if your topic doesn't fit any other channel contexts.
This is the channel to post to if your topic doesn't fit any other channel contexts.
 All technical questions
Community Guidelines MATLAB FAQs