reflectorGrid
Create grid reflector-backed antenna
Description
The default reflectorGrid object creates a grid reflector-backed
antenna resonating around 1 GHz. The grid reflector uses a grid of parallel wires or bars
oriented in one direction. Grid reflectors can be used as high-gain antennas in point-to-point
communications.

Creation
Description
ant = reflectorGrid
ant = reflectorGrid(PropertyName=Value)PropertyName is the property
name and Value is the corresponding value. You can specify several
name-value arguments in any order as
PropertyName1=Value1,...,PropertyNameN=ValueN. Properties that you
do not specify, retain their default values.
For example, reflectorGrid(GroundPlaneWidth=0.6) creates a grid
reflector with a width of 0.6 meters. You can specify multiple name-value pairs.
Properties
Object Functions
axialRatio | Calculate and plot axial ratio of antenna or array |
bandwidth | Calculate and plot absolute bandwidth of antenna or array |
beamwidth | Beamwidth of antenna |
current | Current distribution on antenna or array surface |
charge | Charge distribution on antenna or array surface |
design | Create antenna, array, or AI-based antenna resonating at specified frequency |
efficiency | Calculate and plot radiation efficiency of antenna or array |
EHfields | Electric and magnetic fields of antennas or embedded electric and magnetic fields of antenna element in arrays |
feedCurrent | Calculate current at feed for antenna or array |
impedance | Calculate and plot input impedance of antenna or scan impedance of array |
info | Display information about antenna, array, or platform |
memoryEstimate | Estimate memory required to solve antenna or array mesh |
mesh | Generate and view mesh for antennas, arrays, and custom shapes |
meshconfig | Change meshing mode of antenna, array, custom antenna, custom array, or custom geometry |
msiwrite | Write antenna or array analysis data to MSI planet file |
numGridsToSpacing | Calculate grid spacing in for reflectorGrid object |
optimize | Optimize antenna and array catalog elements using SADEA or TR-SADEA algorithm |
pattern | Plot radiation pattern of antenna, array, or embedded element of array |
patternAzimuth | Azimuth plane radiation pattern of antenna or array |
patternElevation | Elevation plane radiation pattern of antenna or array |
peakRadiation | Calculate and mark maximum radiation points of antenna or array on radiation pattern |
rcs | Calculate and plot monostatic and bistatic radar cross section (RCS) of platform, antenna, or array |
resonantFrequency | Calculate and plot resonant frequency of antenna |
returnLoss | Calculate and plot return loss of antenna or scan return loss of array |
show | Display antenna, array, AI-based antenna, platform, or shape |
sparameters | Calculate S-parameters for antenna or array |
stlwrite | Write mesh information to STL file |
vswr | Calculate and plot voltage standing wave ratio (VSWR) of antenna or array element |
Examples
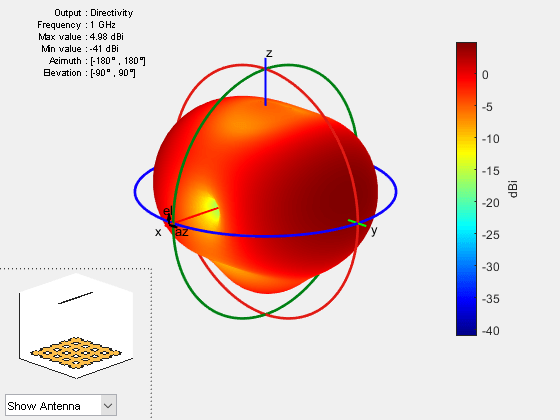
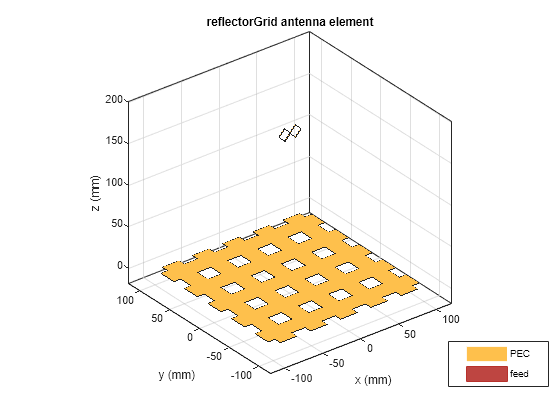
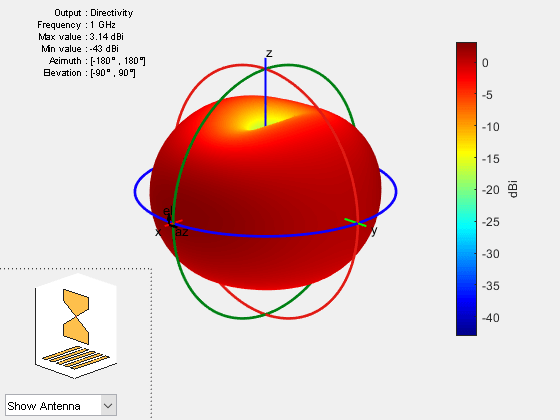
Create and view a grid reflector-backed antenna object with default properties.
ant = reflectorGrid;
show(ant)

Plot the radiation pattern of the antenna at 1 GHz.
pattern(ant,1e9)
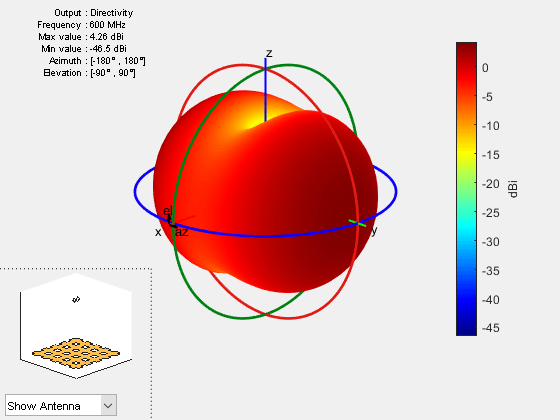
Create and view a grid reflector-backed biquad antenna with an arm length of 0.01 meters.
b = biquad(ArmLength=0.01);
h = reflectorGrid(Exciter=b);
show(h)
Plot the radiation pattern of the antenna at 0.6 GHz.
pattern(h,0.6e9)
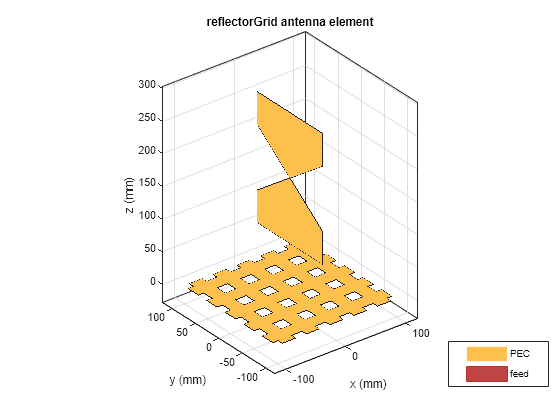
Create and view grid reflector-baked dipole blade antenna.
d = dipoleBlade(Length=0.1,TaperLength=0.05,FeedGap=0.002);
h = reflectorGrid(Exciter=d);
show(h)
Change the grid type from "HV" to "H".
h.GridType = "H";View the antenna with grid type "H".
show(h)

Plot the radiation pattern at 1 GHz.
pattern(h,1e9)
Create a rectangular array of cylindrical dipole antennas.
d = dipoleCylindrical(Length=0.2,Radius=0.005);
arr = rectangularArray(Element=d,Size=[4 4],RowSpacing=0.029,ColumnSpacing=0.029);
Create a grid reflector-backed rectangular array.
ant = reflectorGrid(Exciter=arr,Spacing=0.2)
ant =
  reflectorGrid with properties:

              Exciter: [1×1 rectangularArray]
              Spacing: 0.2000
    GroundPlaneLength: 0.2000
     GroundPlaneWidth: 0.2000
             GridType: 'HV'
          GridSpacing: 0.0180
            GridWidth: 0.0220
            Conductor: [1×1 metal]
                 Tilt: 0
             TiltAxis: [1 0 0]
                 Load: [1×1 lumpedElement]
show(ant)
Create and visualize a grid reflector-backed antipodal Vivaldi antenna.
ant = reflectorGrid(Exciter=vivaldiAntipodal)
ant =
  reflectorGrid with properties:

              Exciter: [1×1 vivaldiAntipodal]
              Spacing: 0.1750
    GroundPlaneLength: 0.2000
     GroundPlaneWidth: 0.2000
             GridType: 'HV'
          GridSpacing: 0.0180
            GridWidth: 0.0220
            Conductor: [1×1 metal]
                 Tilt: 0
             TiltAxis: [1 0 0]
                 Load: [1×1 lumpedElement]
show(ant)
This example shows how to create and analyze a planar reflector grid structure without any exciter element, using planeWaveExcitation.
Create default reflector grid antenna
Create a reflector grid antenna operating at 1 GHz using the design function and the reflectorGrid element from the antenna catalog, and view it.
f=1e9;
ant=design(reflectorGrid,f);
figure;
show(ant)

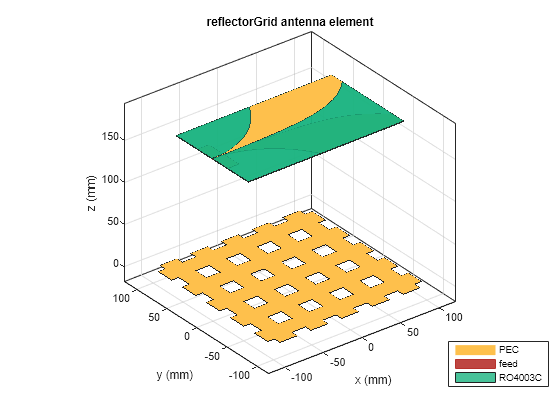
Derive backing structure
Derive the backing structure from this reflector grid antenna by assigning empty value to the 'Exciter' property and view it.
ant.Exciter=[]
ant =
  reflectorGrid with properties:

              Exciter: []
              Spacing: 0.1749
    GroundPlaneLength: 0.2000
     GroundPlaneWidth: 0.2000
             GridType: 'HV'
          GridSpacing: 0.0180
            GridWidth: 0.0220
            Conductor: [1×1 metal]
                 Tilt: 0
             TiltAxis: [1 0 0]
                 Load: [1×1 lumpedElement]
figure;
show(ant)

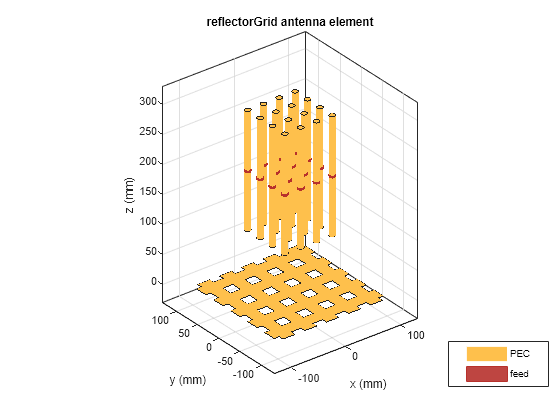
Mesh reflector grid
Mesh the grid structure with a maximum edge length of 10 mm.
figure;
mesh(ant,MaxEdgeLength=10e-3)

Plot surface current distribution
Use planewave excitation to excite the grid structure and plot the surface current distribution at 1 GHz.
pw=planeWaveExcitation(Element=ant,Direction=[0 0 -1],Polarization=[1 0 0])
pw =
  planeWaveExcitation with properties:

         Element: [1×1 reflectorGrid]
       Direction: [0 0 -1]
    Polarization: [1 0 0]
      SolverType: 'MoM'
figure;
current(pw,f,Scale="log10")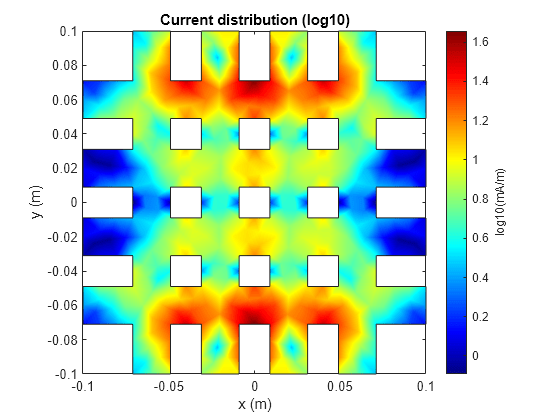
References
[1] Balanis, Constantine A. Antenna Theory: Analysis and Design. 3rd ed. Hoboken, NJ: John Wiley, 2005.
Version History
Introduced in R2020b