Pull up a chair!
Discussions is your place to get to know your peers, tackle the bigger challenges together, and have fun along the way.
- Want to see the latest updates? Follow the Highlights!
- Looking for techniques improve your MATLAB or Simulink skills? Tips & Tricks has you covered!
- Sharing the perfect math joke, pun, or meme? Look no further than Fun!
- Think there's a channel we need? Tell us more in Ideas
Updated Discussions

I am frequently facing issue with the onramp training of not proceeding to the next task or section, even after successfully completion of the current task or complete section.

For the past several days I have been experiencing a problem with data visualization on two of my ThingSpeak channels.
The data appears to be uploaded and stored correctly, and new entries are still being added to the channels. However, the visualizations are not working correctly.
The standard Field Charts show only a very small number of data points instead of the normal continuous measurements. Most of the points are compressed on the left side of the chart, while one or a few points appear far to the right and are connected by long straight lines. The time axis is also incorrect and sometimes shows repeated dates such as “01 Jan”.
The numeric widgets are affected as well and display incorrect values. Some custom visualizations also remain blank or fail to load.
The problem appeared suddenly and affects two separate channels which had previously been working correctly. I did not make any significant changes to the channels before the problem started.
This seems somewhat similar to the ThingSpeak chart/timeline issue reported in June 2026, when charts were displaying incorrect time ranges and the DAYS/RESULTS settings were not working correctly. However, my current problem also affects numeric widgets and custom visualizations, and the charts show incorrect dates and strangely positioned data points.
Could this be a regression or a similar issue with the ThingSpeak visualization system?
Has anyone else experienced the same problem recently?

Many widely cited coding style guides originate from large-scale software engineering contexts: multi-developer teams, large codebases, separate reviewers, tooling-driven workflows, and a focus on completed, delivered code. While those constraints are valid in their domain, they often map poorly onto scientific and engineering scripting as it is often practiced with MATLAB.
In laboratory and engineering environments, code serves a different role. It is frequently written by individuals or small groups, and then iteratively modified, copied, adapted, and extended as part of an evolving problem-solving process. In this context, the primary priorities are not strict stylistic consistency or tooling compatibility or delivery, but rather:
- maintaining clarity of underlying structure,
- minimizing the risk of errors during modification, and
- supporting rapid comprehension of mathematically or logically dense code.
This raises the question: should fixed line-length limits be replaced by context-aware principles? Could these be supported by a suitable AI tool?
The following proposal outlines a small set of heuristics governing line length, based on observations of real-world MATLAB usage, particularly for numerically intensive and structurally rich code. These heuristics aim to:
- preserve and expose meaningful structure (e.g. systems of equations, tables, repeated patterns)
- avoid formatting that obscures relationships or introduces errors, and
- treat different kinds of code (logic vs. data vs. structured expressions) appropriately.
Scope
These principles apply to scientific and engineering scripting, particularly:
- MATLAB-like environments
- numerically or structurally dense code
- monolithic or semi-monolithic workflows
- code that is frequently modified, copied, and adapted
They are not intended for large-scale commercial software engineering, where different constraints dominate.
Core Objective
Line length and formatting should maximize comprehension, structural clarity, and correctness under modification, rather than enforce arbitrary limits.
Hierarchy of Heuristics
Higher-numbered heuristics take precedence over lower-numbered ones.
1) Reasonable Line Length
Code intended for reading should use a reasonable line length, guided by:
- human visual comprehension when scanning
- clarity of expression
- preservation of logical units
This would tend toward 70-100 characters per line, depending on the density.
2) Preserve Semantic Integrity of Lines
Line breaks must not split code in ways that degrade understanding.
Avoid:
- dangling fragments
- very short continuation lines
- separation of tightly coupled elements
- etc.
Prefer:
- keeping logically cohesive expressions intact
- breaking only at clear structural boundaries
One slightly longer line is preferable to two poorly structured lines.
3) Treat Data as Data (Not Prose/Code)
Code that primarily represents data rather than logic is not intended for sequential reading.
This includes:
- large numeric vectors
- lookup tables
- pasted datasets
- etc.
Such code:
- may exceed line length limits without restriction
- should prioritize density and structural stability
- should minimize its vertical real-estate
- is assumed to be accessed via search or indexing rather than visual parsing
Readability of data as code is not the objective; retrievability and integrity are. Yes, this intentionally rejects the enterprise rule that data must be separate from code, instead the IDE should support workflows that some real-world users actually employ, for example by displaying embedded data differently.
4) Preserve and Expose 2D Structure
If code encodes a logical, mathematical, or tabular structure with inherent spatial relationships, it should be represented accordingly.
This includes:
- systems of equations
- tabulated data
- repeated structured expressions
- etc.
Requirements:
- alignment should be used where it improves comprehension
- patterns should be visually apparent
- deviations from patterns should be easily detectable
This principle should be applied strongly, tending toward mandatory use where feasible.
Exception
If a structure would become impractically wide, a compromise representation may be used.
Breaking meaningful spatial structure is considered harmful to comprehension and correctness.
5) Preserve Structural Consistency Across Similar Code
Code segments representing similar or related logic should be expressed in consistent structure and layout.
This applies to:
- repeated formulas
- analogous computations
- structurally similar transformations
- etc.
Consistency enables:
- rapid comparison
- detection of inconsistencies
- safer modification
Similar logic should be represented in similar ways.
Meta-Principles
A. Structure Over Style
Line lengths should reflect the underlying structure of the problem, not conform to arbitrary limits.
B. Correctness Over Convention
Avoid line lengths and formatting that:
- obscures patterns
- hides inconsistencies
- increases the risk of modification errors
C. Optimize for Modification
Code in this domain is frequently:
- edited
- duplicated
- extended
- adapted by changing parameters, values, or datasets
- commented out for testing different versions
- etc.
Line lengths should reduce the likelihood of errors during these operations, for example by keeping atomic concepts on the same line rather than splitting them up.
D. Anomaly Visibility
Formatting should make unexpected deviations immediately visible.
E. Tool Support
An intelligent tool should:
- respect and preserve structural layout
- avoid rigid line-length enforcement
- detect patterns and inconsistencies
- assist rather than constrain the programmer
This is not a request for explanations of how scientific users can comply with enterprise software-engineering practices (I am quite aware of those practices). Instead, this thread suggests that those tools and practices could be redesigned around the characteristics of scientific work. I would be interested to hear how well these ideas match others’ experience, particularly in scientific or engineering workflows.
See also:

This Week's Quiz
105 responses

Agentic AI is changing how engineers work. Join Jason Ghidella to see how AI agents can help accelerate coding, modeling, requirements generation, testing, and validation with MATLAB and Simulink, while maintaining the rigor needed to trust the results.
See real-world demonstrations spanning app building, system modeling, simulation, test generation, and system validation, and discover what the future of AI-powered engineering looks like.

The Ran In tag still shows R2026a on Answers and Discussions (as does the Executing In popup), even though both are actually running R2026b.
This seems to be always be an issue whenver the site updates to the latest release. Seems like it should be pretty straightforward to update those message at the same time the underlying release is updated. Or am I underestimating the complexity of that task?
matlabRelease
Week of September 21, 2026
164 responses

To celebrate 25 years of MATLAB Central community, we're launching two community contests designed to inspire learning, creativity, and knowledge sharing.
🚀 Now Open: STEM Showcase Contest
Have a great math, science, or engineering concept to share? Create an interactive MATLAB experience that helps others learn, explore, and discover STEM concepts.
Learn more and enter: STEM Showcase Contest
Prizes:
- STEM domain awards: Amazon Gift Card
- Weekly prizes: MathWorks T-shirts or socks
- Exclusive virtual badge
🎮 Coming in November: MATLAB One-Button Game Mini Hack
Can you build a fun game using only one button? Start brainstorming now and get ready for a unique MATLAB Game Mini Hack challenge.
For 25 years, MATLAB Central has been powered by a community that loves learning, building, and sharing knowledge. Whether you're an educator, researcher, engineer, student, or hobbyist, we'd love to see what you create.

Hello everyone. I am noob at coding and want to learn advance level of matlab and i want a book for me to help me learn from scratch and make sure its well thing and i am mostly interested in mechatronics like how a system acts and behaves so please give me some reccomandation also i am frustated.
What if MATLAB could show you not only the final output, but also how your code reaches that result?
Imagine an interactive tool that visualizes variable changes, function calls, matrix transformations, and execution flow as a program runs. Engineers could watch algorithms evolve, identify unexpected behavior, and understand complex simulations through live visualizations.
The idea is to build a Live MATLAB Execution Explorer that combines code tracing, variable timelines, and 3D engineering simulations in one interface.
From debugging control systems to teaching numerical methods, this could transform how students, researchers, and engineers interact with code.
The challenge? Capturing execution data efficiently without significantly affecting performance.
The vision: Turn programming from something we read into something we can see, explore, and understand.
#MATLAB #Simulink #EngineeringInnovation #Simulation #DeveloperTools

I recently had an idea for a side project: building an app/extension that can interactively follow simulations and visualise the live flow of code execution.
For this, I would need access to variables, datasets, and the function call stack during execution, ideally without interfering with the actual code execution.
However, I found that MATLAB's current architecture makes this difficult, as the entire application runs in a single thread and there are no publicly exposed APIs to access runtime variables without interrupting execution.
Can anyone suggest a possible workaround or an alternative approach to achieve this?

To develop uifigure-based app, I wish MATLAB can provide something like uiquestdlg to replace questdlg without changing too much of the original code developed for figure-based app. Also, uiinputdlg <-> inputdlg and so on.

Extremely--I have real work to do
24%
Maybe talk about something else?
24%
Neutral
24%
Not very much
24%
Let's talk about nothing else
5%
21 votes

Week of September 28, 2026
217 responses

Week of October 5, 2026
207 responses
I keep forgetting the functions and lack of pratices would be the reason
I recently had an idea for a side project: building an app/extension that can interactively follow simulations and visualise the live flow of code execution.
For this, I would need access to variables, datasets, and the function call stack during execution, ideally without interfering with the actual code execution.
However, I found that MATLAB's current architecture makes this difficult, as the entire application runs in a single thread and there are no publicly exposed APIs to access runtime variables without interrupting execution.
Can anyone suggest a possible workaround or an alternative approach to achieve this?
Ready to explore the latest advancements in engineering and science with MATLAB and Simulink?
MATLAB EXPO Online 2026 is taking place November 4-5, 2026, and registration is now open. Join engineers, researchers, educators, and industry leaders from around the world for two days of technical presentations, hands-on workshops, customer success stories, and live Q&A sessions.
What to Expect
✅ 40+ interactive sessions featuring MathWorks experts and industry leaders
✅ 5 technical tracks, including AI and Agentic AI, Digital Engineering and Model-Based Design, Electrification and Energy Systems, Robotics and Autonomous Systems, and Cloud, CI/CD and DevOps
✅ 9 live, 90-minute hands-on workshops using MATLAB Online and Simulink Online
✅ Keynotes on emerging engineering trends and the latest MATLAB and Simulink capabilities
✅ Opportunities to connect with experts and peers from around the globe through live Q&A and networking activities
Whether you're just getting started or are an experienced MATLAB and Simulink user, you'll find content tailored to a range of experience levels and application areas.
Participation is free, but registration is required. Reserve your spot and start building your personalized agenda today.
What session or topic are you most excited to explore this year? Let us know in the comments!
Hello everyone
After you read the blog post about all the new goodness in MATLAB 2026b I am sure you'll rush out to install it. If you do one more thing, however, I suggest that you install this add-on from MATLAB File-Exchange since it will make object-oriented code much faster.
"How much faster?" I hear you ask. This much faster:
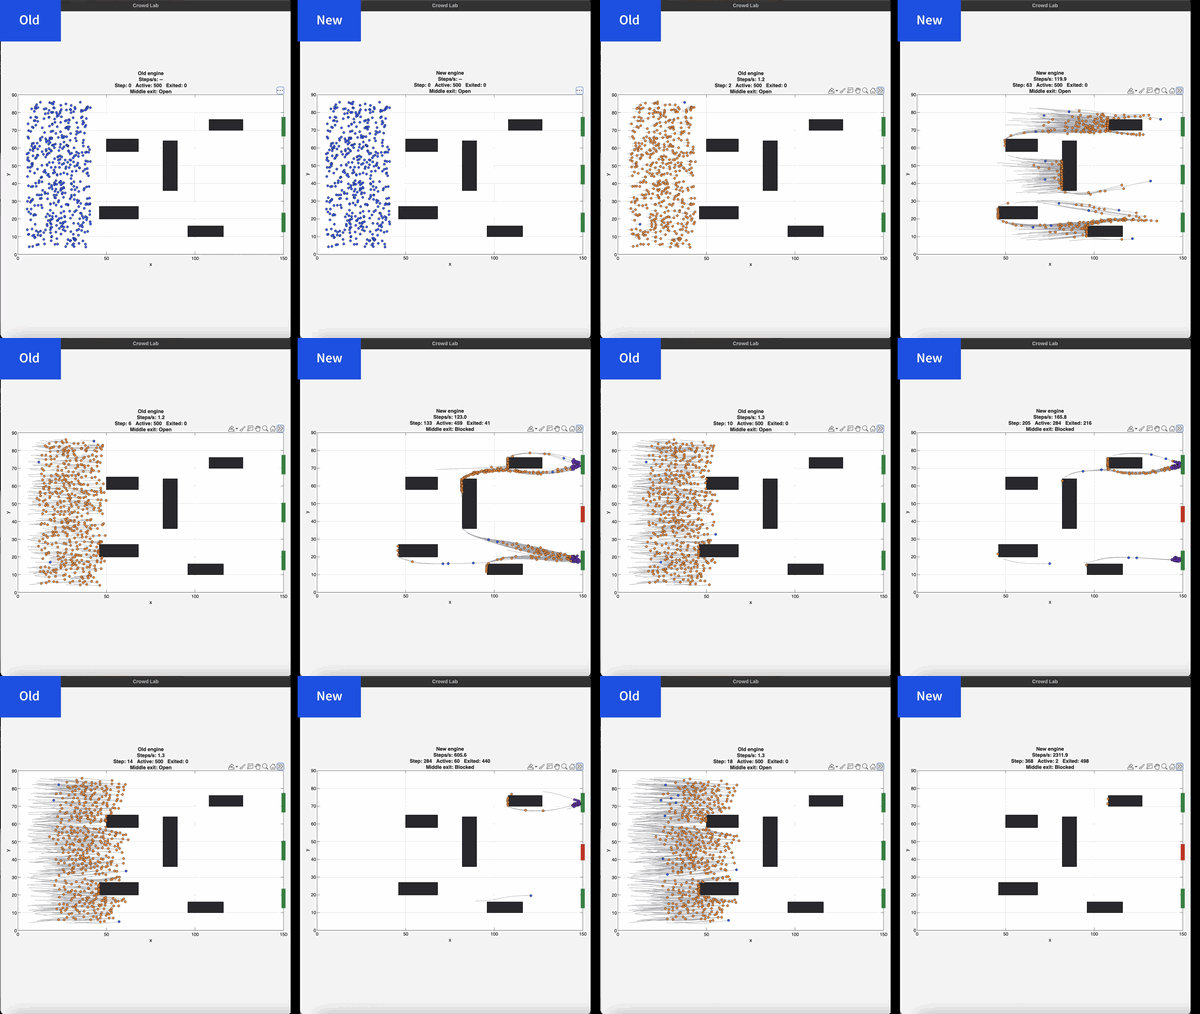
If you prefer numbers to pictures, all of the details are in a blog post from when we released the limited beta: Objects are about to get much faster in MATLAB » The MATLAB Blog - MATLAB & Simulink
"Why didn't we make this the default?" I hear you ponder. Because there is a small chance that the new system will break your code. It's a very small chance and I've personally not seen any code that does get broken. However, such code does exist and we want to be give you the chance to discover this and work with us to make your code compatibile before it does become the default.
I hope you enjoy using 2026b as much as we enjoyed making it.
Cheers,
Mike
Hello, everyone! I’m Mark Hayworth, but you might know me better in the community as Image Analyst. I've been using MATLAB since 2006 (18 years). My background spans a rich career as a former senior scientist and inventor at The Procter & Gamble Company (HQ in Cincinnati). I hold both master’s & Ph.D. degrees in optical sciences from the College of Optical Sciences at the University of Arizona, specializing in imaging, image processing, and image analysis. I have 40+ years of military, academic, and industrial experience with image analysis programming and algorithm development. I have experience designing custom light booths and other imaging systems. I also work with color and monochrome imaging, video analysis, thermal, ultraviolet, hyperspectral, CT, MRI, radiography, profilometry, microscopy, NIR, and Raman spectroscopy, etc. on a huge variety of subjects.
I'm thrilled to participate in MATLAB Central's Ask Me Anything (AMA) session, a fantastic platform for knowledge sharing and community engagement. Following Adam Danz’s insightful AMA on staff contributors in the Answers forum, I’d like to discuss topics in the area of image analysis and processing. I invite you to ask me anything related to this field, whether you're seeking recommendations on tools, looking for tips and tricks, my background, or career development advice. Additionally, I'm more than willing to share insights from my experiences in the MATLAB Answers community, File Exchange, and my role as a member of the Community Advisory Board. If you have questions related to your specific images or your custom MATLAB code though, I'll invite you to ask those in the Answers forum. It's a more appropriate forum for those kinds of questions, plus you can get the benefit of other experts offering their solutions in addition to me.
For the coming weeks, I'll be here to engage with your questions and help shed light on any topics you're curious about.
About Discussions
Discussions is a user-focused forum for the conversations that happen outside of any particular product or project.
Get to know your peers while sharing all the tricks you've learned, ideas you've had, or even your latest vacation photos. Discussions is where MATLAB users connect!
Get to know your peers while sharing all the tricks you've learned, ideas you've had, or even your latest vacation photos. Discussions is where MATLAB users connect!
More Community Areas

MATLAB Answers
Ask & Answer questions about MATLAB & Simulink!

File Exchange
Download or contribute user-submitted code!

Cody
Solve problem groups, learn MATLAB & earn badges!

Blogs
Get the inside view on MATLAB and Simulink!

AI Chat Playground
Use AI to generate initial draft MATLAB code, and answer questions!

